Guaranteeing faster speeds for generating maps of climate change through time
In January, the ≥…»À¥Û∆¨‚Äôs, Environment Institute launched PaleoView on Google Cloud.
Guest post byÃ˝Julia Aaron Pilowsky
provides users with the capability to generate climatic conditions over the past 21,000 years in a matter of minutes to hours, depending on the region and time period of interest.
PaleoView is a freeware developed by researchers in the Environment Institute’s Climate Eco-Evolutionary Dynamics group at the . It provides a portal for generating and viewing continuous monthly climate data since the earth emerged from the last glacial period.
PaleoView accurately reproduces major climatic features associated with the end of the last ice age, and predicts present-day patterns of climate conditions with . The data behind PaleoView comes from the CCSM, a model that charts changes in climate from day to day over the millennia.
The tool and supporting data are being used by researchers to pinpoint where and when rapid high magnitude climate change events occurred in the past, the likely responses of biodiversity to these climatic changes, and their implications for conserving biodiversity under future climate change.
For example, PaleoView was used recently by a research team led by Dr to locate past . Regions where nearby organisms were able to persist, prosper and for new lineages to spawn during periods of global scale disruptive climate change. They then projected the extent and location of these climate safe havens under anthropogenic climate change and found that more than 75% of the area of these climate safe havens will be lost in the near future due to 21st century warming, negatively affecting biodiversity

Ã˝
From Brown et al. 2020
The areas highlighted in green are biodiversity hotspots, and the areas highlighted in blue are climate safe havens, which the researchers identified using data from PaleoView. The areas on the right highlighted in orange are past safe havens that are expected to be affected by rapid warming in the future.
PaleoView is also being used by educators around the world to teach students about climate science and climate change ecology. Faster download and data generation speeds achieved by hosting PaleoView on google cloud will further increase the use of the freeware in undergraduate and postgraduate courses.
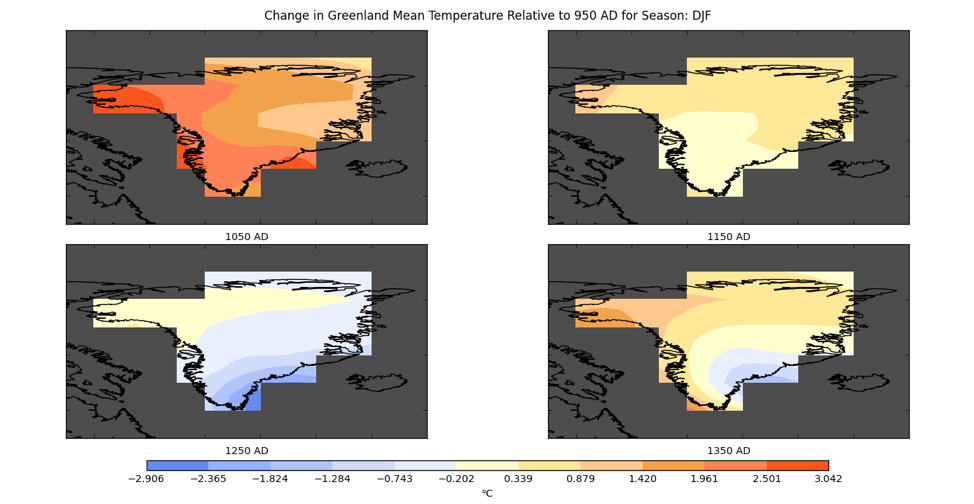
As an example of how PaleoView can be used in the classroom, imagine you are a history teacher with a lesson about the first European settlement in Greenland. It is thought that the success of this settlement is at least partly because it was established during the Medieval Warm Period from 900 to 1300 CE. You could invite students to think about the role of climate in the rise and fall of this settlement by having them use PaleoView to generate temperature maps of the region in 985, when the settlement was founded, and in 1424, when the settlement died out. Students could use PaleoView to map and determine the potential role of climate warming in the rise and fall of this settlement, and more generally to explore how climates shape historical events.

These maps show the mean winter temperature in Greenland every 100 years, relative to the mean winter temperature in 950, approximately when the settlement was founded. We can see that the temperature stayed relatively warm for the first two centuries, and then it began to drop, especially in the southern part of Greenland where the settlement was based.
and the data behind it are free to use. They are hosted on Google, with reliable and fast downloads.
Brown, S.C., Wigley, T.M.L., Otto-Bliesner, B.L.Ã˝et al.Ã˝Persistent are hospices for biodiversity in the Anthropocene.Ã˝Nat. Clim. Chang.Ã˝(2020).
Fordham, D. A., Saltré, F., Haythorne, S., Wigley, T. M., Otto-Bliesner, B. L., Chan, K. C., & Brook, B. W. (2017). PaleoView: A tool for generating continuous climate projections spanning the last 21 000 years at regional and global scales. Ecography, 40(11), 1348–1358.

Newsletter & social media
Join us for a sensational mix of news, events and research at the Environment Institute. Find out aboutÃ˝new initiatives andÃ˝share with your friends what's happening.
Ã˝Ã˝Ã˝
